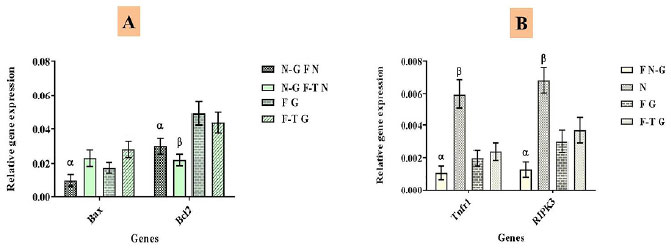
Figure 5. Evaluation of cell apoptosis and necrosis in the epididymal fat region grafted testis tissues. A) Real-time PCR analysis of apoptosis gene expression. N-G F N: Non-grafted fresh neonate, F-T N: Non-grafted fresh neonate; F G: Fresh grafted; and F-T G: Frozen-thawed grafted. B) Real-time PCR analysis of necrosis gene expression. F N-G: Fresh non-grafted, N: Necrosis model (induced torsion*), F G: Fresh grafted, and F-T G: Frozen-thawed grafted. mRNA levels were normalized relative to Actb as an internal control. Histograms display the mean expression values (± SEM, n=3; p<0.05). α, β: Significant difference between this gene and other groups. *: Testicular torsion was accomplished via a midline, ventral incision. Each testis was exposed through the incision, and the gubernaculum and the avascular epididymal-testicular membrane were incised. The testis was rotated at 720° for 2 hours