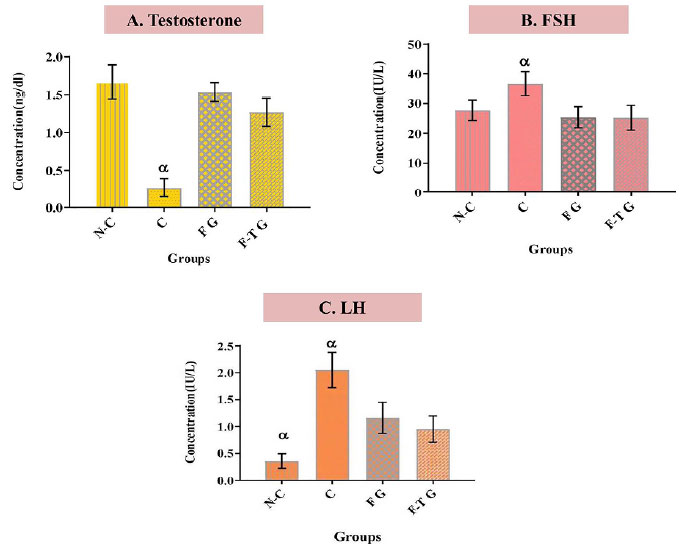
Figure 9. Serum Testosterone, FSH, and LH Levels. N-C: Non-castrated adult mouse, C: Castrated adult mouse, F G: Fresh grafted, and F-T G: Frozen-thawed grafted. Histograms show mean expression values (± SEM, n=3; p<0.05). α: Significant difference with other groups in the same hormone.