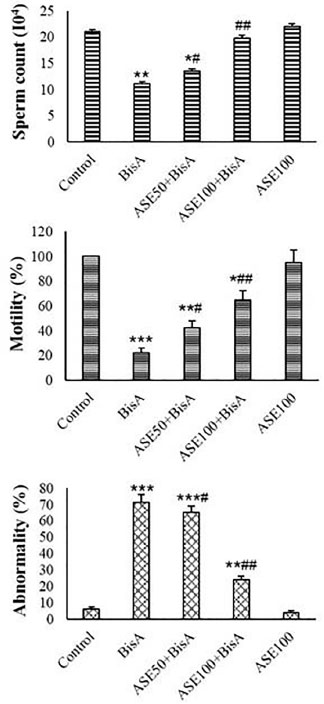
Figure 2. Total rat sperm motility (%), abnormality (%), and count in the various groups (mean±SD, n=5). * and # indicate comparisons against control and BisA-treated groups, respectively.
Figure 2. Total rat sperm motility (%), abnormality (%), and count in the various groups (mean±SD, n=5). * and # indicate comparisons against control and BisA-treated groups, respectively.