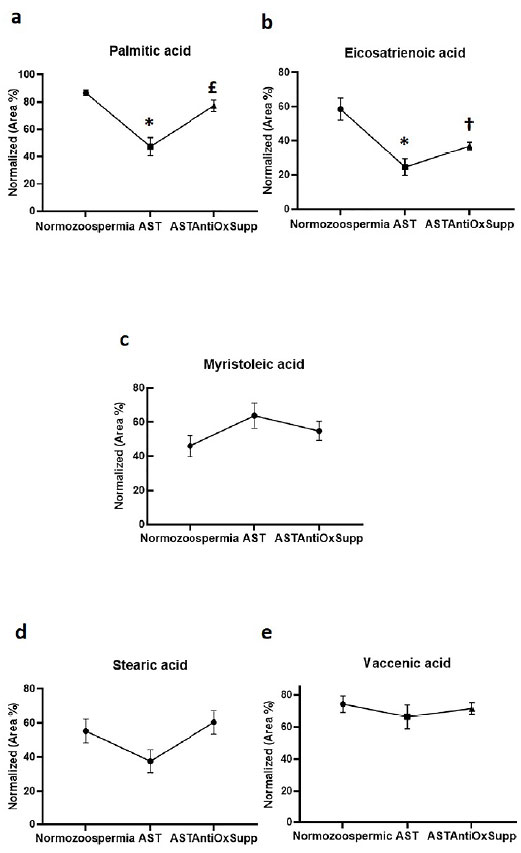
Figure 2. The pattern of palmitic acid (a), eicosatrienoic acid (b), myristoleic acid (c), stearic acid (d), and vaccenic acid (e) levels in normozoospermic patients (n=29) and following antioxidant therapy in asthenozoospermic patients (n=51). The values are expressed as the normalized mean (±SEM) area percentage. AST, asthenozoospermic; ASTAntiOxSupp, asthenozoospermic after antioxidant supplementation.* Significant difference between normozoospermia and AST£ Significant difference between AST and ASTAntiOxSupp† Significant difference between normozoospermia and ASTAntiOxSupp.