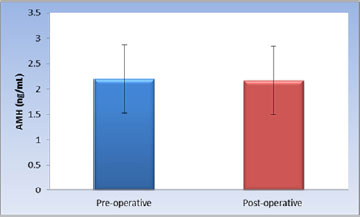
Figure 2. Bar chart representing mean and standard deviation values for AMH pre- and post-operatively.