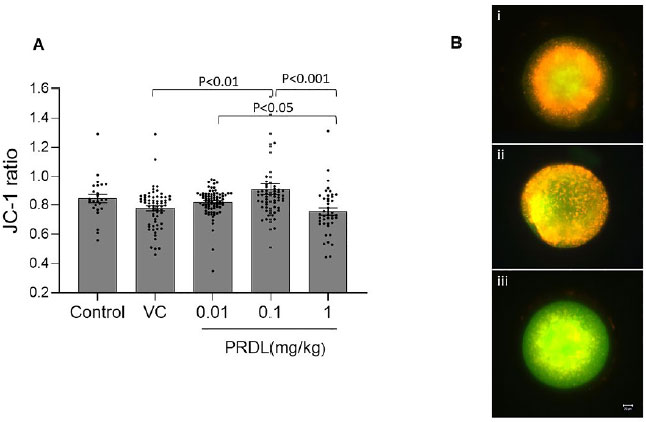
Figure 1. Mitochondrial membrane potential of oocytes after PRDL administration. A. Comparison of mitochondrial potential by JC-1 staining in control (n=25), VC (n=65), 0.01 (n=79), 0.1 (n=66) and 1mg/kg (n=42) PRDL-treated oocytes. B i-iii. Representative fluorescence microscopy images (40×) of JC-1-stained oocytes in decreasing order of mitochondrial potential. Scale bar =20 µm.