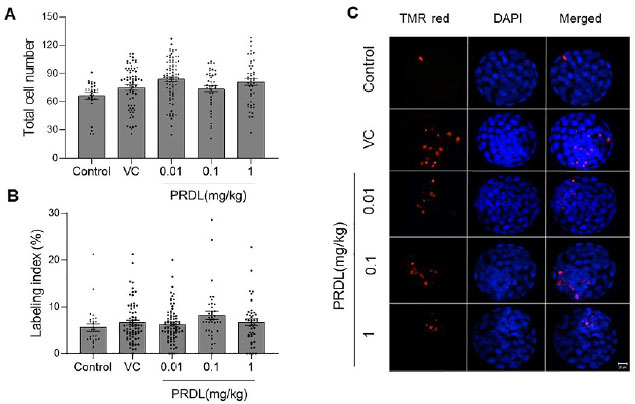
Figure 2. Impact of PRDL on blastocyst cell number and DNA integrity. A. Comparison of total cell numbers and B. Labeling indices of blastocysts from the control (n=27), VC (n=70), 0.01 (n=80), 0.1 (n=38) and 1 mg/kg (n=45) PRDL groups. C. Representative fluorescence microscopy (40×) images showing TUNEL-positive cells (red) and total cells (blue). Scale bar =20 µm.