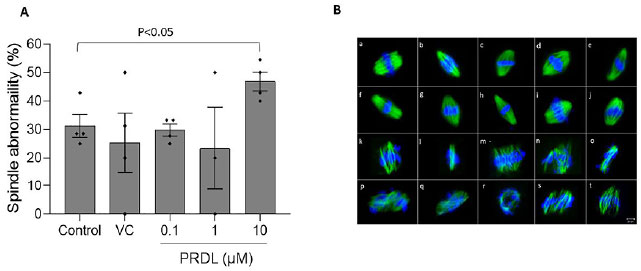
Figure 3. Spindle integrity of oocytes exposed to PRDL in vitro. A. Comparison of the percentage of spindle abnormalities in control (n=29), vehicle control (n=28), 0.1 µM (n=34), 1 µM (n=21), and 10 µM (n=36) PRDL-exposed MII oocytes. C. Representative fluorescence microscopy images (40×) of the spindle. (a-j) normal spindle arrangement; (k-t) damaged spindles and misaligned chromosomes. Scale bar =20 µm.