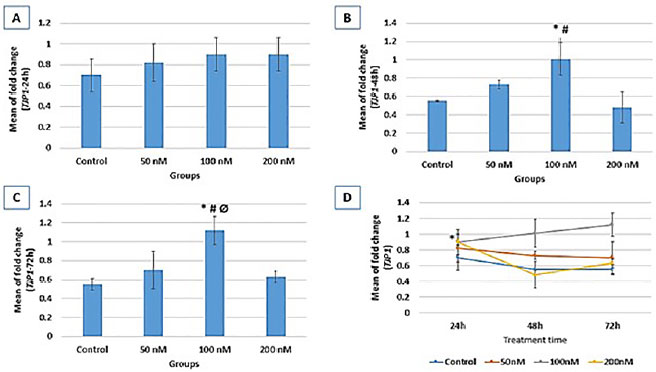
Figure 3. Relative expression fold change of ZO-1 at three different treatment times (A: 24h, B: 48h, and C: 72h). Gene expression results are normalized to β-actin mRNA amplification. B: * vs. control (p=0.009); # vs. 200nM (p=0.004); C: * vs. control (p=0.003); # vs. 50nM (p=0.019); Ø vs. 200 (p=0.008); D: ZO-1 expression process within each group through study course; 200nM (* vs. 48h (p=0.02)).