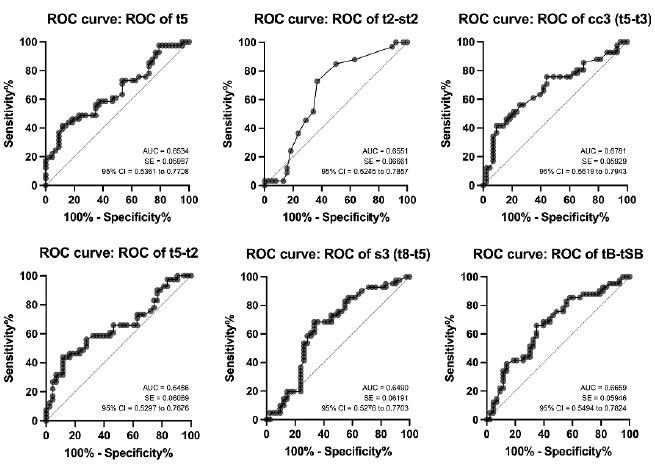
Figure 1. Receiver Operating Characteristic (ROC) curves for t5, t2-st2, cc3 (t5-t3), t5-t2, s3 (t8-t5), and tB-tSB predicting euploidy. AUC, area under the curve; SE, standard error; 95% CI, confidence interval.
Figure 1. Receiver Operating Characteristic (ROC) curves for t5, t2-st2, cc3 (t5-t3), t5-t2, s3 (t8-t5), and tB-tSB predicting euploidy. AUC, area under the curve; SE, standard error; 95% CI, confidence interval.