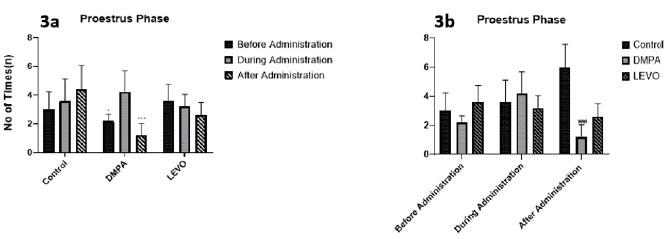
Figure 3. A. Comparing the differences in the duration of Proestrus phase before, during, and after administration within each group. * denotes significant difference p<0.05 compared with During administration, *** denotes significant difference p<0.001 compared with during administration. B. Comparing the differences in the duration of Proestrus phase between groups before, during, and after administration. ### denotes significant difference p<0.001 compared with control group.