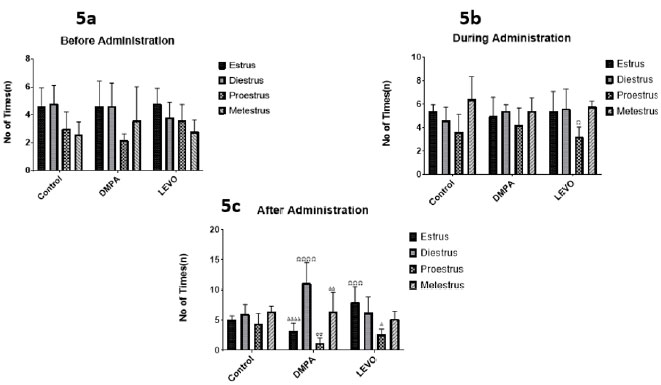
Figure 5. A. Comparing the differences in the duration of the Oestrus cycle across all groups before administration. B. Comparing the differences in the duration of the Oestrus cycle across all groups during administration. Ω denotes significant difference p<0.05 when compared with estrus, diestrus, and mestestrus phases. C. Comparing the differences in the duration of the Oestrus cycle across all groups after administration. ΩΩΩ denotes significant difference p<0.001 compared with Proestrus phase, ΩΩΩΩ denotes significant difference p<0.0001 compared with Proestrus phase, ∆ denotes significant difference p<0.05 compared with Diestrus Phase, ∆∆ denotes significant difference p<0.01 compared with Diestrus phase, ∆∆∆∆ denotes significant difference p<0.0001 compared with Diestrus phase, σσ denotes significant difference p<0.01 compared with Metestrus phase.