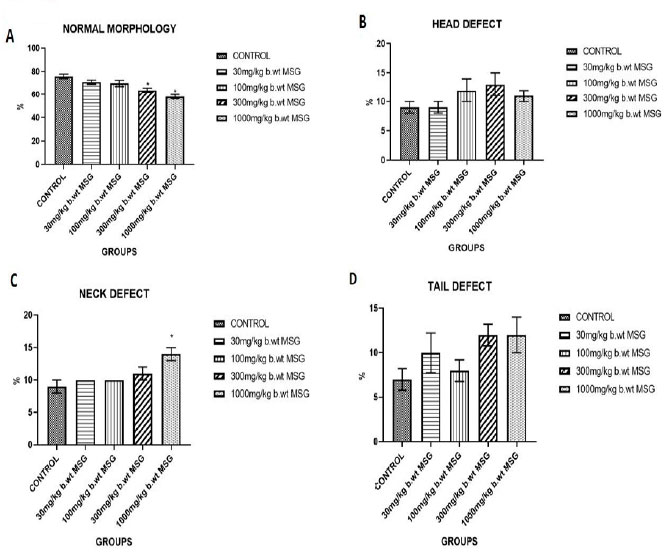
Figure 2. (A) Percentage of normal sperm morphology in male Wistar rats treated with different doses of MSG for 65 days. (B) Percentage of sperm head defects in MSG-treated groups. (C) Percentage of sperm neck defects observed in different MSG exposure groups. (D) Percentage of sperm tail defects across treatment groups. Values represent mean±SEM (n=6). Significant differences compared to the control group are denoted (*p<0.05).