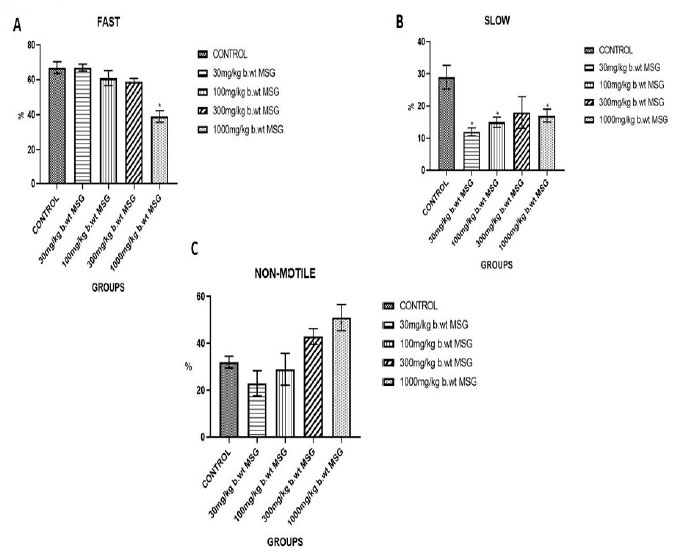
Figure 3. (A) Percentage of fast progressive motility in spermatozoa from male Wistar rats exposed to different MSG doses. (B) Percentage of slow progressive motility in spermatozoa across treatment groups. (C) Percentage of non-motile sperm observed in each treatment group. Values represent mean±SEM (n=6). Significant differences compared to the control group are denoted (*p<0.05).