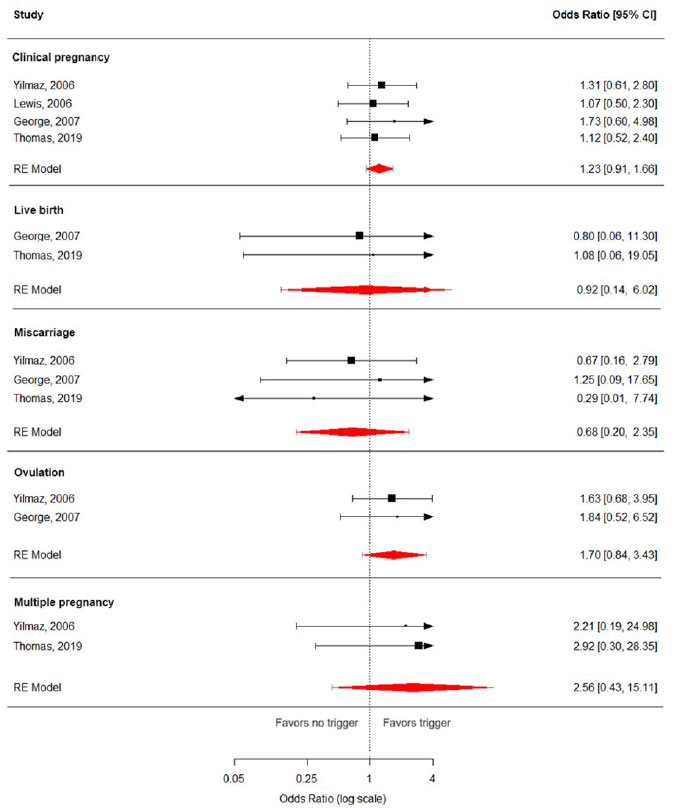
Figure 3. Forest plots for the primary analyses. For all outcomes, I2 = 0, and p-values for Cochran’s Q were within the range of statistical non-significance.
Figure 3. Forest plots for the primary analyses. For all outcomes, I2 = 0, and p-values for Cochran’s Q were within the range of statistical non-significance.