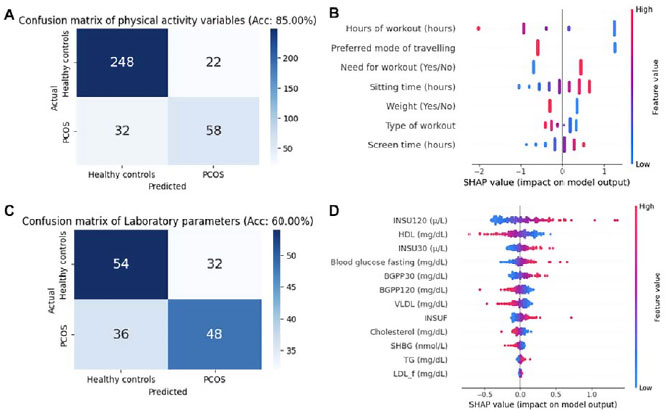
Figure 2. Multivariate logistic regression model and SHAP analysis of the model: A. Confusion matrix showing logistic models based on physical activity features. B. Summary dot plot of the SHAP values of the physical activity-based logistic model, illustrating feature impact (top variables are the most impactful). C. Confusion matrix based on the multivariate logistic model using laboratory parameters. D. Summary dot plot of the SHAP values for laboratory features in the multivariate model.