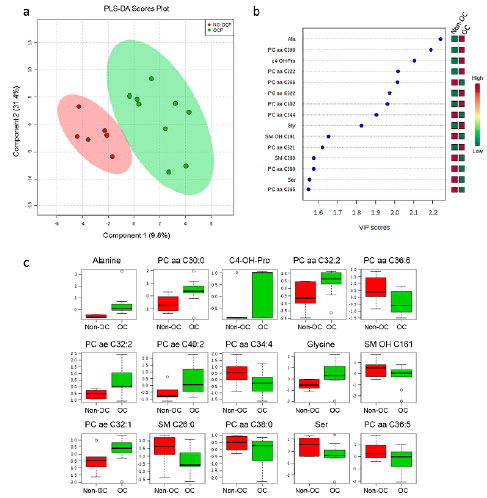
Figure 2. a- PLS-DA Scores Plot demonstrates groups separation considering the metabolomic quantitative analysis of culture media from women using OC (green circles) and not using OC (red circles). b- VIP scores considering the variables of most importance for the PLS-DA regression model. Red boxes indicate metabolites oh higher concentration of the respective metabolite (indicated by abbreviation) for the corresponding group, whereas green boxes indicate lower concentrations of the metabolites for the corresponding groups (Non-OC or OC groups). c- Box plot charts indicate variabilities of samples distribution, and it is possible to observe differences in the metabolites concentration for each group of the study.