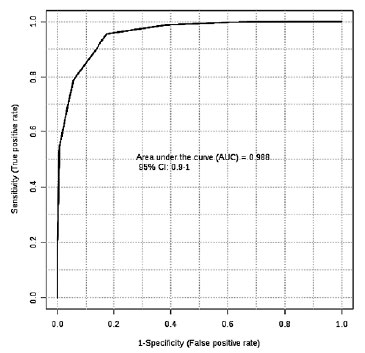
Figure 3. ROC curve analysis shows an AUC= 0.988, considering a confidence interval of 95%. The x axis indicates the Specificity whereas the y axis indicates the Sensitivity of the analysis, by including the set of biomarkers proposed by the PLS-DA regression model.