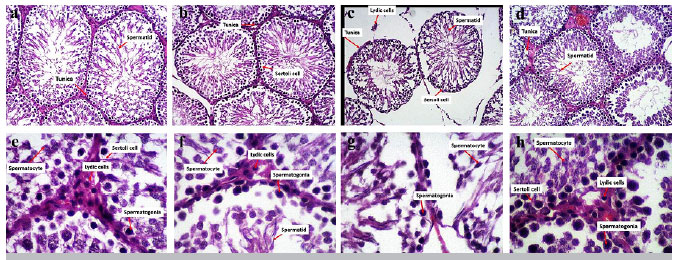
Figure 2. H&E staining images. a and e) Control group, b and f) Sham group: in both groups, normal shape and intact membrane of seminiferous tubules with germ cells and spermatogonial cells in different stages of development. C group: the damage of seminiferous tubules is lower than in the VCL group and higher than in the control and sham group. (a-d have 40X magnification and e-h have 100X magnification).