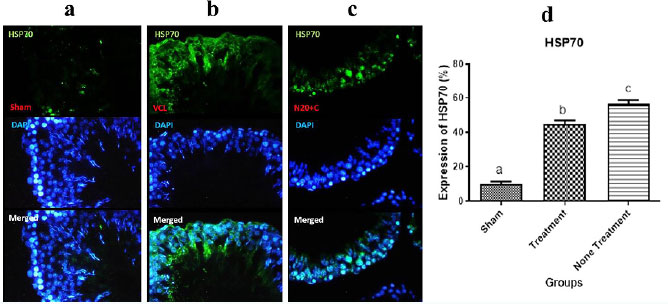
Figure 3. Immunofluorescence staining for Hsp70, a) Immunofluorescence image of the Sham group, the green spot that is the HSP70 expression landmark is lower than in other groups, b) Immunofluorescence image of the VCL (non-treatment) group, increase the HSP70 expression in comparison to other groups, c) Immunofluorescence image of the N20+C (treatment) group, the HSP70 expression is lower than in the VCL group and higher than in the Sham group; and d) The diagram of expression of HSP70, the expression pf HSP70 in the Sham group was lower than in the VCL (non-treatment) and the N20+C (treatment) groups (p<0.001), and in the (treatment) group was lower than in the VCL (non-treatment) (p<0.05).