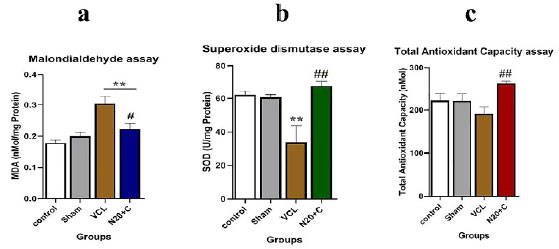
Figure 4. a) MDA level diagram: the MDA level in the VCL group was higher than in the N20+C group (p<0.01); SOD activity diagram: the SOD activity in the N20+C group was higher than in the VCL group (p<0.01) and c) The TAC level diagram: the TAC level in the VCL group was lower than in the N20+C group (p<0.01).