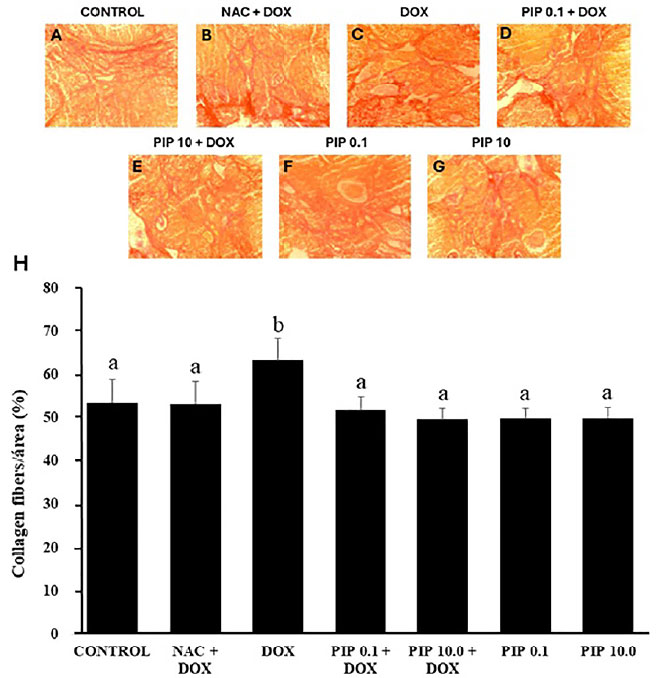
Figure 4. Morphology (A-G) and percentages (H) of collagen fibers area (mean±SD) in mice ovaries treated with NAC and DOX, DOX (10.0mg/kg), PIP (0.1 or 10.0mg/kg) or both PIP and DOX. Collagen fibers distribution was analyzed by the Kruskal-Wallis test, followed by Dunn’s comparison. a and b indicate statistically significant differences between treatments.