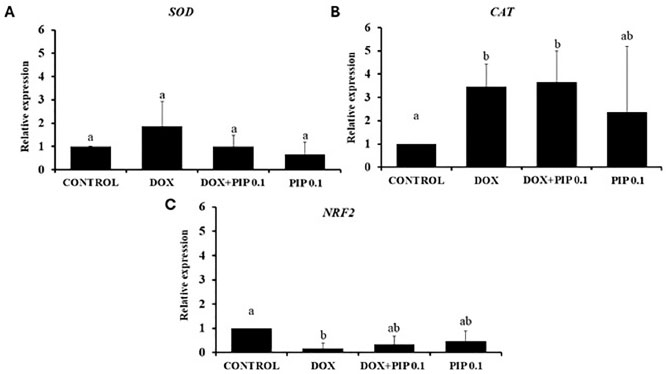
Figure 6. The levels of mRNA for (A) SOD, (B) CAT and (C) NRF2 in ovaries from control mice or treated with DOX (10.0mg/kg), both DOX and 0.1mg/kg PIP or only 0.1mg/kg PIP. Levels of mRNA for CAT, SOD and NRF2 were analyzed by the Kruskal-Wallis test, followed by the Dunn comparison. a, b different lowercase letters indicate significant difference between treatments (p<0.05).