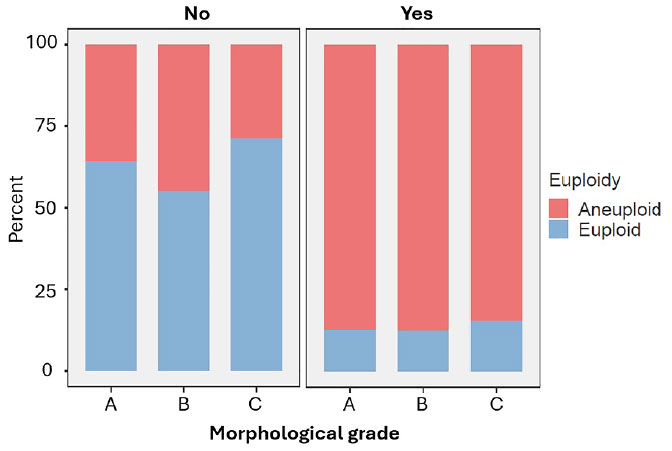
Figure 10. Euploidy Rates Across Morphological Grades According to the Presence or Absence of ICM/TE Fragmentation. Stacked bar plots representing the proportion of euploid (blue) and aneuploid (red) embryos across morphological grades A, B, and C, stratified by the absence (No, left panel) or presence (Yes, right panel) of fragmentation in the inner cell mass (ICM) and/or trophectoderm (TE). Each panel shows the chromosomal status distribution within each morphological category based on fragmentation status.