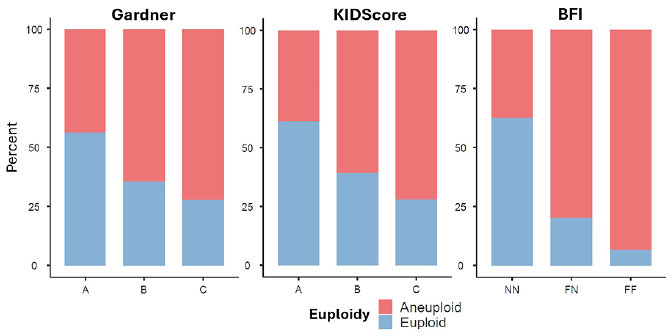
Figure 7. Euploidy Rates According to Gardner Grading, KIDScore, and the Blastocyst Fragmentation Indicator (BFI). Stacked bar plots showing the proportion of euploid (blue) and aneuploid (red) embryos across morphological grades (A, B, C) using the Gardner system (left panel), the KIDScore classification (middle panel), and the BFI categories (right panel): NN (no fragmentation), FN (fragmentation in the inner cell mass), and FF (fragmentation in both the inner cell mass and trophectoderm). The figure illustrates the distribution of chromosomal status within each scoring system.