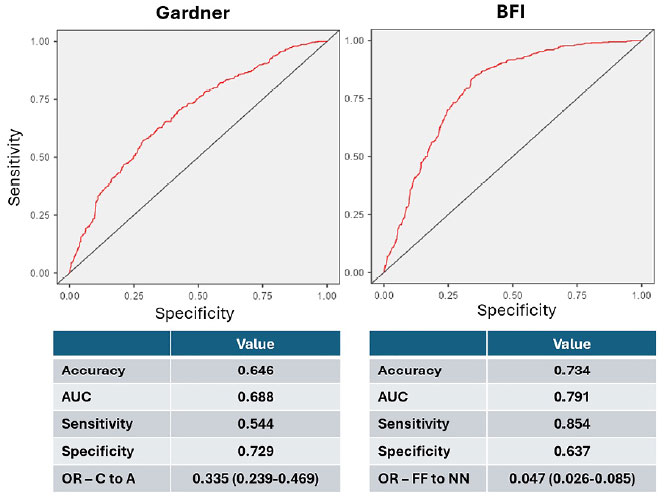
Figure 8. ROC Curves and Performance Metrics Comparing Gardner Grading and ICM/TE Fragmentation (BFI). Receiver operating characteristic (ROC) curves (top) and corresponding diagnostic metrics (bottom) comparing the predictive performance of the Gardner grading system (left panel) and the Blastocyst Fragmentation Indicator (BFI) based on inner cell mass (ICM) and trophectoderm (TE) fragmentation (right panel). Performance measures include accuracy, area under the curve (AUC), sensitivity, specificity, and odds ratios (OR) for the lowest scoring categories (Gardner grade C vs. A; FF vs. NN in BFI).