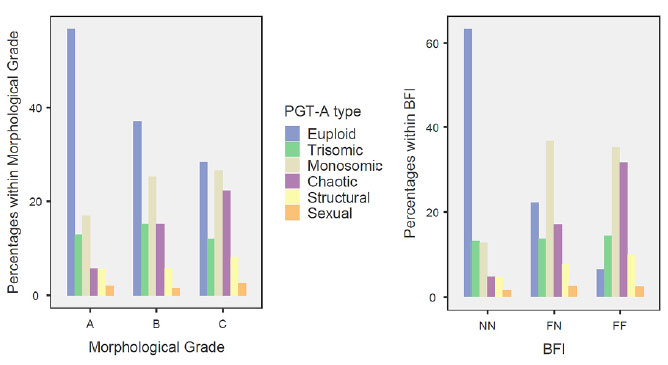
Figure 9. Distribution of PGT-A Aneuploidy Types According to Morphological Grade and BFI Classification. Stacked bar charts showing the relative distribution of preimplantation genetic testing for aneuploidy (PGT-A) results by aneuploidy type across morphological grades (left panel: A, B, C) and Blastocyst Fragmentation Indicator (BFI) categories (right panel: NN = no fragmentation, FN = fragmentation in inner cell mass, FF = fragmentation in both inner cell mass and trophectoderm).