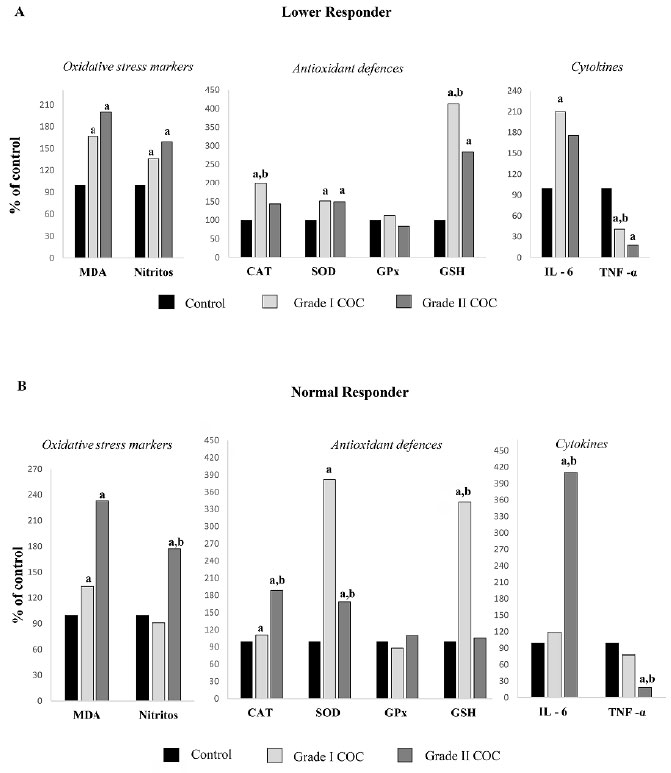
Figure 5. Redox and inflammatory profile in LR and NR women according COCs morphological grading. The results are expressed in percentage (%) of the values obtained in women LR and NR versus controls, considering the values in controls as 100%. LR: Lower responder; NR: Normal responder; COCs: cumulus-oocyte complexes. a Significantly different p<0.001 respect to control group. b Significantly different p<0.001 respect to the other groups.