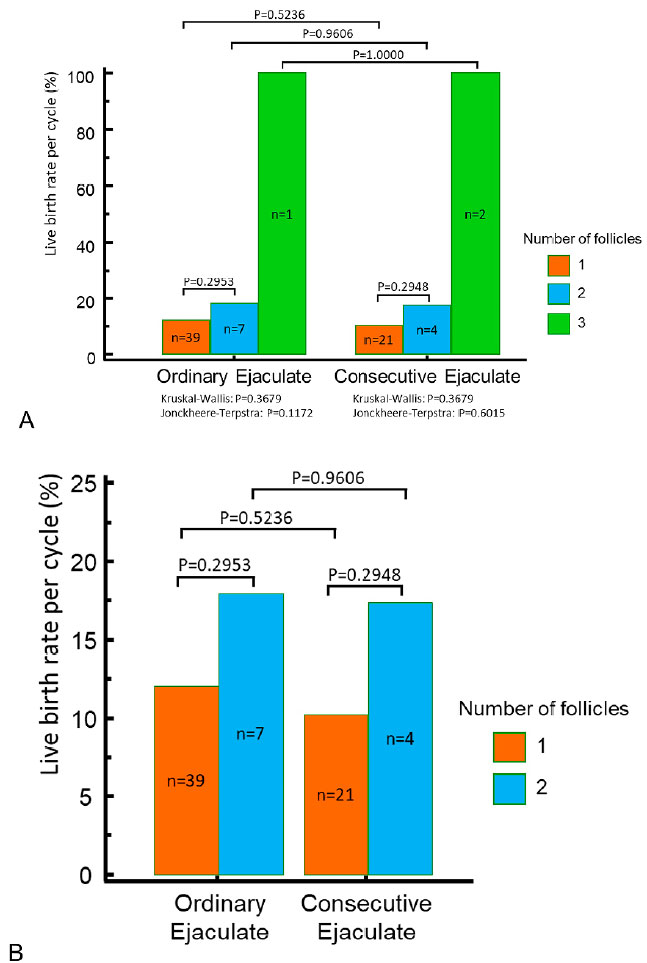
Figure 1. Comparison of live birth rates per cycle according to the number of follicles observed. Distribution of live birth rates among 3 (A) and 2 (B) follicles. No difference between the groups can be seen.
Figure 1. Comparison of live birth rates per cycle according to the number of follicles observed. Distribution of live birth rates among 3 (A) and 2 (B) follicles. No difference between the groups can be seen.