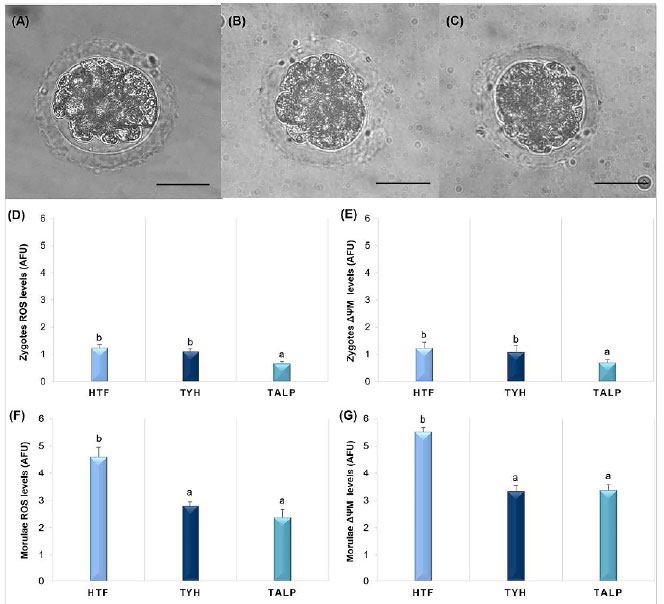
Figure 4. Effect of different he-IVF media on presumptive zygotes and morulae ROS production and mitochondrial membrane potential (∆Ψm). (A) Representative image of morulae on D5 of culture after being fertilized in HTF, (B) TYH, and (C) TALP media. (D) ROS levels in arbitrary fluorescence units (AFU) from labeled zygotes with the H2DCFDA fluorescent probe. (E) ∆Ψm levels from labeled zygotes with MitoTracker Red fluorescent probe. (F) ROS levels from labeled morulae. (G) ∆Ψm levels from labeled morulae. Different letters (a,b) indicate a statistically significant difference between treatments (p<0.05). Scale Bar = 20 μm. Magnification: 40 ×.