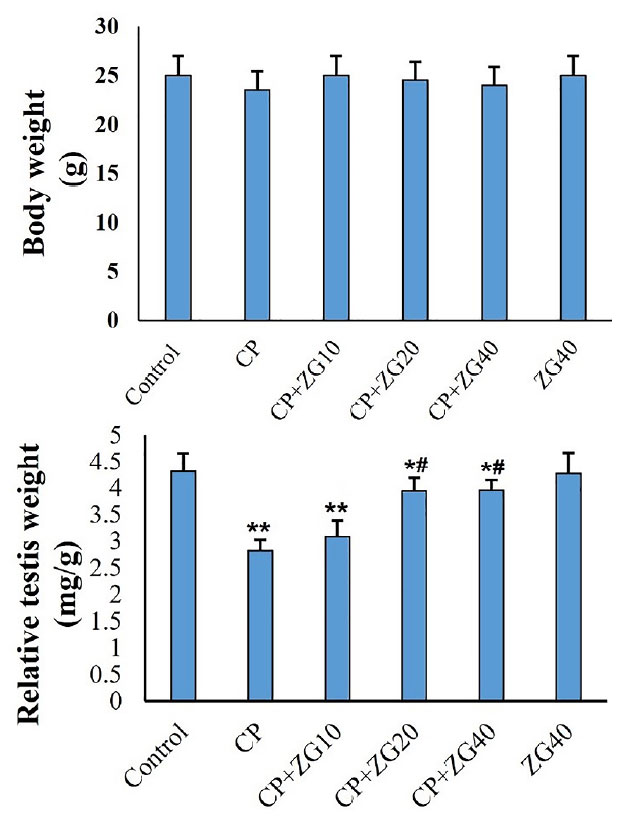
Figure 2. Effects of ZG on (A) body weight and (B) relative testes weight in CP-treated mice. Data are illustrated in mean±SD (n=6). *p<0.05, **p<0.01, #p<0.05. Symbols indicate comparison to the control (*) and CP (#) groups (one-way ANOVA followed by Tukey’s post-hoc test).