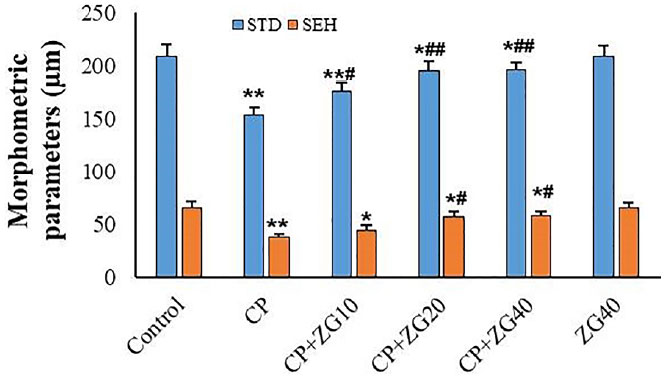
Figure 5. Histopathological evaluation of testicular tissue in: Control, CP-treated, CP +ZG10, CP +ZG 20, CP +ZG40, and ZG-alone groups. Two blinded investigators independently analyzed 100 seminiferous tubules per animal using Motic software to measure tubule diameter and epithelial height. Data are presented as mean±SD (n=6 groups). *p<0.05 and **p<0.01 vs control group; #p<0.05 and ##p<0.01 vs CP group (one-way ANOVA with Tukey’s post-hoc test).