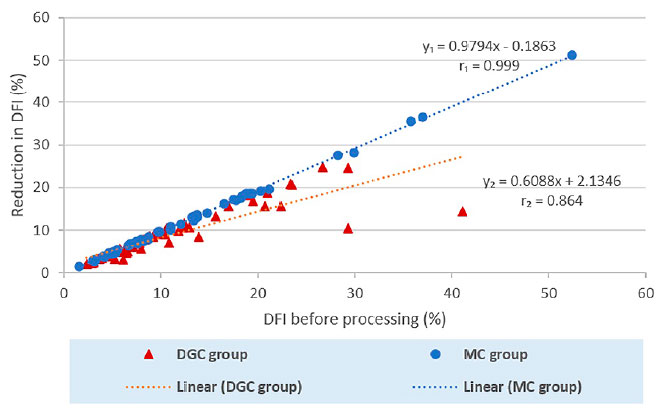
Figure 1. Correlation between initial DNA Fragmentation Index (DFI) and reduction in DFI after sperm processing using two different methods. The graph illustrates the relationship between DFI before processing and the percentage reduction in DFI in two groups: the DGC group (red triangles) and the MC group (blue circles). Linear regression lines were fitted for each group.