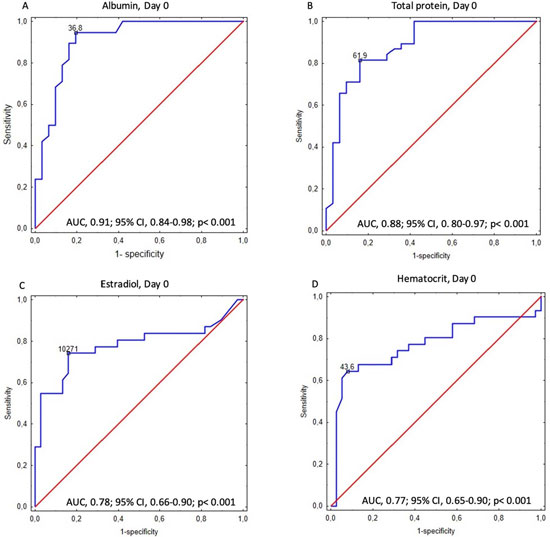
Figure 3. ROC curves for albumin Day 0 (panel A), total protein day 0 (panel B), estradiol Day 0 (panel C), hematocrit Day 0 (panel D). The outcomes investigated in the ROC analysis were moderate (panel A and B) along with severe OHSS occurrence (panel C and D).