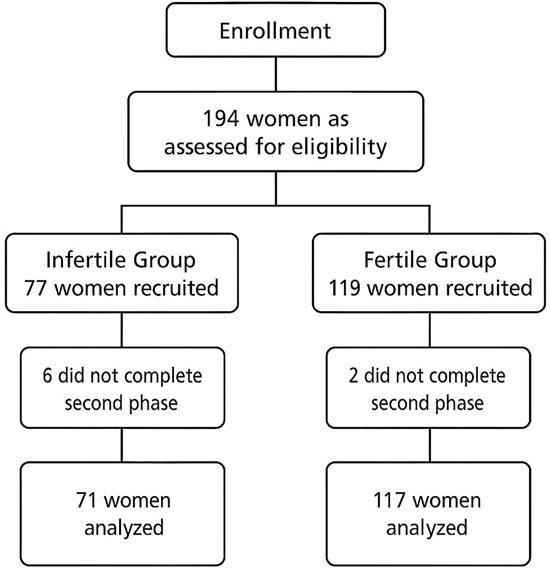
Figure 1. CONSORT flow diagram illustrating the recruitment, exclusion, and final inclusion of infertile (n=71) and fertile (n=117) women evaluated in both study phases
Figure 1. CONSORT flow diagram illustrating the recruitment, exclusion, and final inclusion of infertile (n=71) and fertile (n=117) women evaluated in both study phases