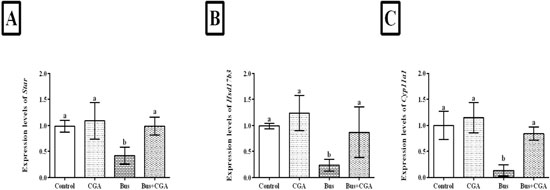
Figure 2. mRNA expression levels of (A) STAR, (B) HSD17B3, and (C) CYP11A1 in rat testicular tissue across experimental groups after 60 days of treatment. Data are presented as mean±SEM. Based on the Tukey post-hoc test, groups with the same superscripts (a, b) show no significant difference (p=0.05), while different superscripts indicate significant differences (p<0.05).