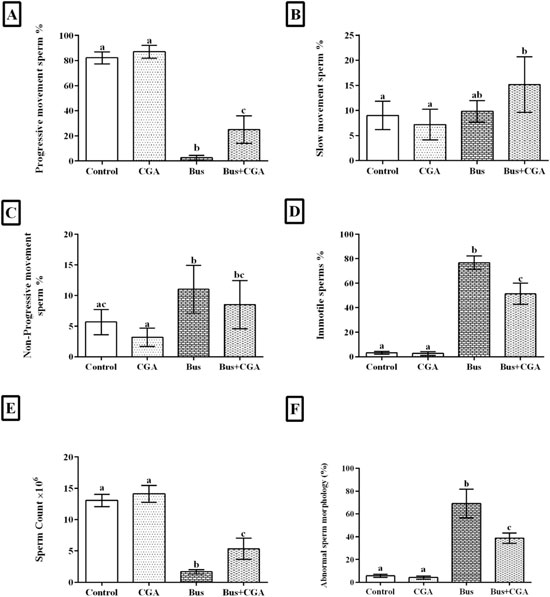
Figure 5. Sperm motility, count, and morphology in the experimental groups. The column graphs represent (A) sperm count, (B) percentage of morphologically normal sperm, and (C) percentage of motile sperm after treatment. Data are expressed as mean±SD. According to the post-hoc Tukey test used for intergroup comparisons, groups with the same superscripts (b, c, d) are not significantly different at α=0.05 (p=0.05). However, dissimilar letters indicate a statistically significant difference (p<0.05).