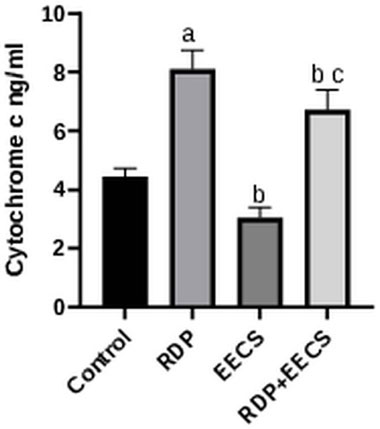
Figure 6. Effect of EECS Treatment on Cytochrome c Levels in RDP-exposed Male Wistar Rats. Values are expressed as mean ± SEM (n=7). Where a represents p<0.05 vs. control; b represents p<0.05 vs. RDP; c represents p<0.05 vs. EECS.
Figure 6. Effect of EECS Treatment on Cytochrome c Levels in RDP-exposed Male Wistar Rats. Values are expressed as mean ± SEM (n=7). Where a represents p<0.05 vs. control; b represents p<0.05 vs. RDP; c represents p<0.05 vs. EECS.