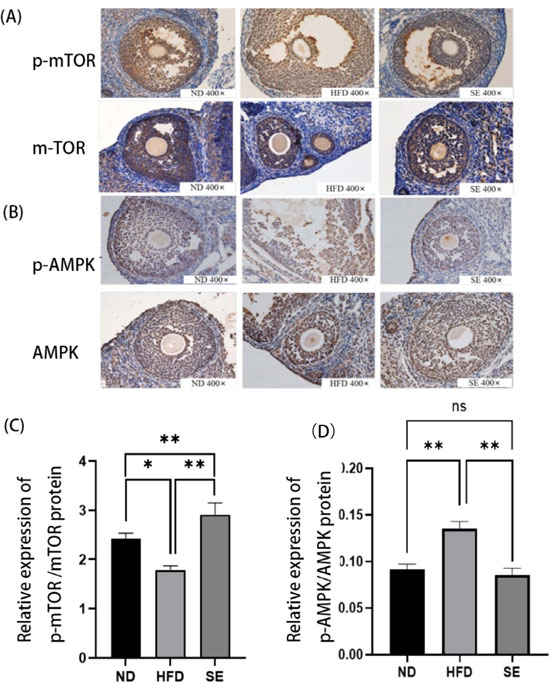
Figure 3. Immunohistochemical analysis of p-mTOR/mTOR and p-AMPK/AMPK expression in ovarian granulosa cells under obesity and exercise-induced weight loss conditions(A) Representative immunohistochemical staining of p-mTOR/mTOR in ovarian paraffin sections (ND, n=8; HFD, n=8; SE, n=8).(B) Representative immunohistochemical staining of p-AMPK/AMPK in ovarian paraffin sections (ND, n=6; HFD, n=9; SE, n=8).(C) Quantitative analysis of p-mTOR/mTOR expression levels.(D) Quantitative analysis of p-AMPK/AMPK expression levels.Data are expressed as mean ± SEM. Statistical significance is indicated as follows: *p<0.05, **p<0.01.