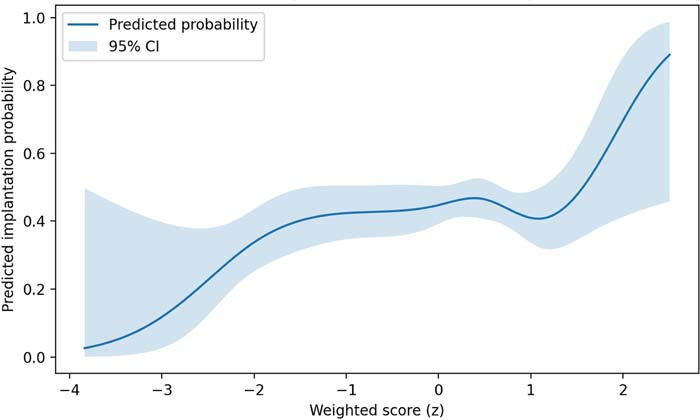
Figure 1. Association between the weighted composite score and predicted implantation probability. Predicted implantation probability according to the weighted composite score, modelled using a restricted cubic spline with four knots. The solid line represents the estimated implantation probability, and the shaded area indicates the 95% confidence interval. The score was constructed from standardised final blastocyst area, minimal ZP thickness, and blastocyst expansion, weighted by regression coefficients. Increasing score values reflect a more favourable blastocyst profile and are associated with higher implantation probability.