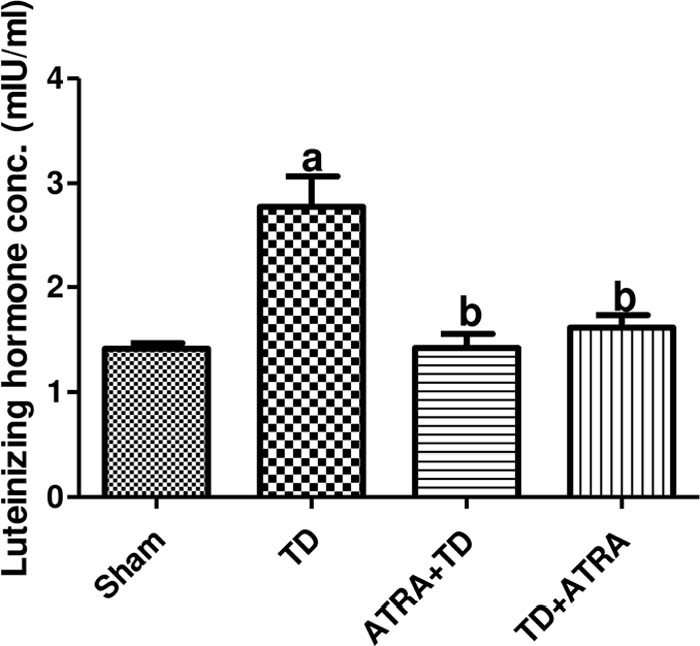
Figure 17. Effect of ATRA on Luteinizing concentration in the ipsilateral Testis following TDData were presented as mean ± SEM (n=6). arepresents significant increase at (p<0.01) compared with the sham group. brepresents significant decrease at (p<0.01) com-pared with the TD group