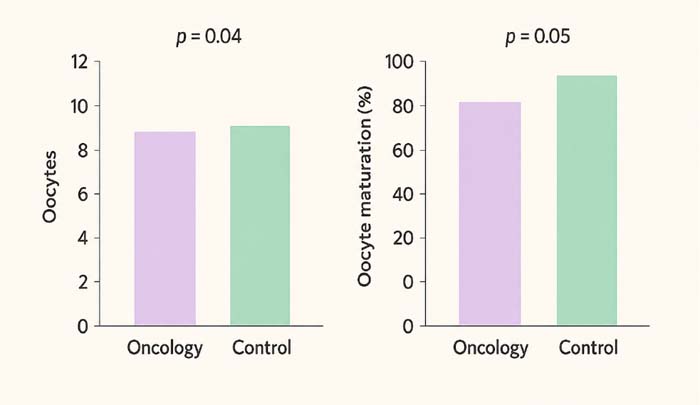
Figure 3.
Comparison of oocyte yield and maturation rates between oncology and control groups