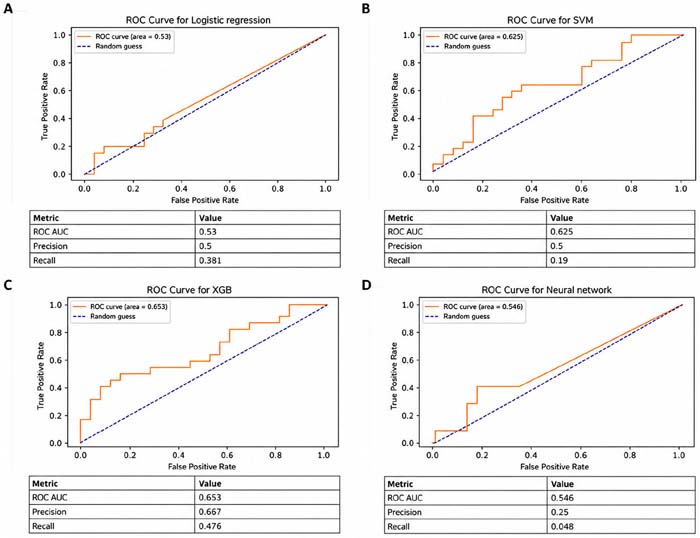
Figure 1. Receiver operating characteristic (ROC) curves and corresponding performance metrics for logistic regression, support vector machines (SVM), artificial neural networks (ANN), and extreme gradient boosting (XGBoost). Each ROC curve illustrates the trade-off between sensitivity (true-positive rate) and 1 - specificity (false-positive rate) across different decision thresholds, providing an overall assessment of model discrimination.