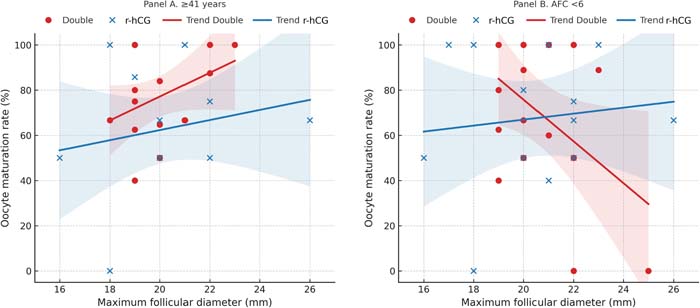
Figure 2. Correlation between maximum follicular diameter and oocyte maturation rate in patient subgroupsScatterplot showing the correlation between maximum follicular diameter (mm) and oocyte maturation rate (%) according to trigger type (Double: GnRH-agonist+β-hCG vs. r-hCG alone). Panel A: patients aged ≥41 years (double trigger n=15, r-hCG n=13). Panel B: patients with antral follicle count (AFC) <6 (double trigger n=17, r-hCG n=13). Trend lines and 95% confidence bands are shown.