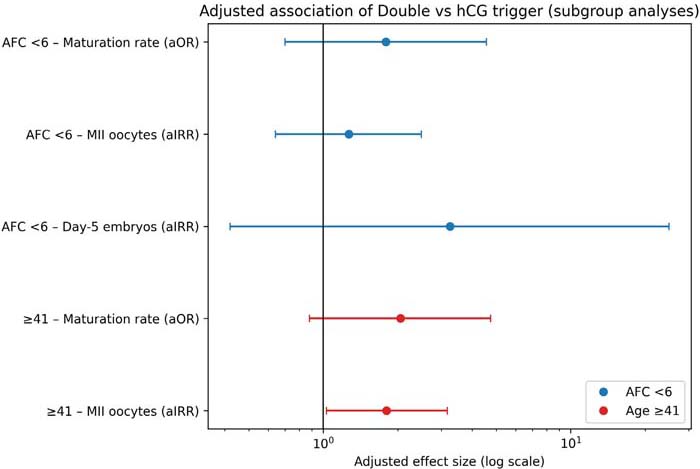
Figure 3. Adjusted association between trigger type and reproductive outcomes in poor-prognosis subgroupsForest plot showing adjusted effect estimates for the association between trigger type (modified double trigger vs. hCG alone) and reproductive outcomes in poor-prognosis subgroups. Points represent adjusted odds ratios (aOR) for oocyte maturation rate and adjusted incidence rate ratios (aIRR) for count outcomes, with horizontal lines indicating 95% confidence intervals. Models were adjusted for age, antral follicle count, body mass index, pituitary suppression protocol (antagonist vs. PPPS), total gonadotropin dose, and gonadotropin combination (FSHr + hMG vs FSHr or hMG). Blue markers represent patients with low ovarian reserve (AFC <6), and red markers represent women aged ≥41 years. The vertical line indicates no effect (effect estimate=1).