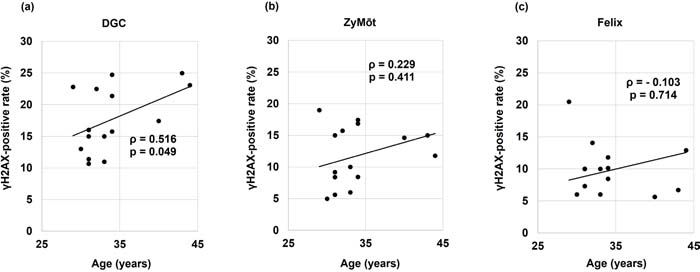
Figure 2. Exploratory correlation between patient age and γH2AX-positive rateScatter plots show the relationship between patient age and the γH2AX-positive rate (%) in sperm prepared by (a) DGC, (b) ZyMōt, and (c) Felix (n=15). Spearman’s rank correlation coefficient (ρ) and the corresponding two-tailed p-value are shown in each panel. This analysis was exploratory; because correlations were assessed across three methods, p-values should be interpreted cautiously. Solid lines indicate linear trend lines for visualization only.