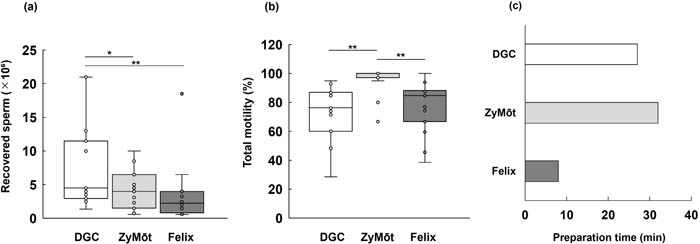
Figure 3. Comparison of outcomes among different sperm selection methods(a) Number of recovered sperm (×106 per 0.5 mL). (b) Sperm total motility (%). (c) Workflow-defined processing time (min). Box plots indicate the median, interquartile range (IQR), and individual data points for (a) and (b). Overall differenc-es were assessed by the Friedman test, followed by Wilcoxon signed-rank tests with Bonferroni correction; effect sizes are reported as Hodges-Lehmann estimated paired differences with 95% confidence intervals. Preparation time (c) represents fixed durations defined a priori by the standardized protocol for each method (hands-on steps plus device-related waiting periods) and therefore was not subjected to statistical testing. Asterisks indicate significant differences after pairwise com-parisons with Bonferroni correction (**adjusted p<0.01, *adjusted p<0.05).