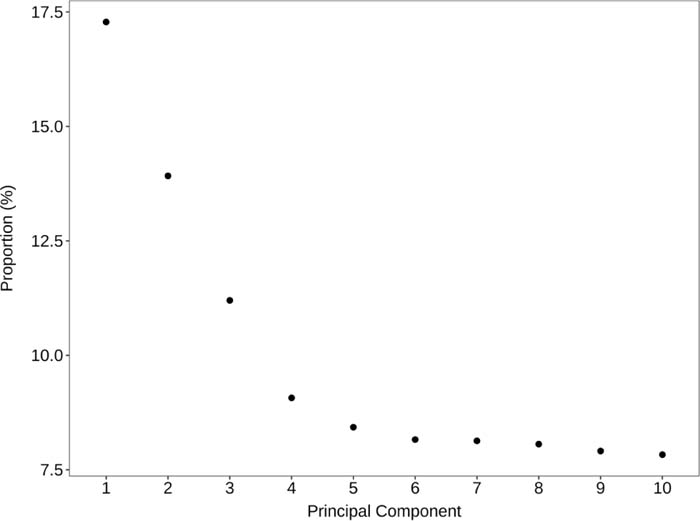
Figure 1. The scree plot demonstrates the variance explained by principal components with an inflection point observed at PC4
Figure 1. The scree plot demonstrates the variance explained by principal components with an inflection point observed at PC4