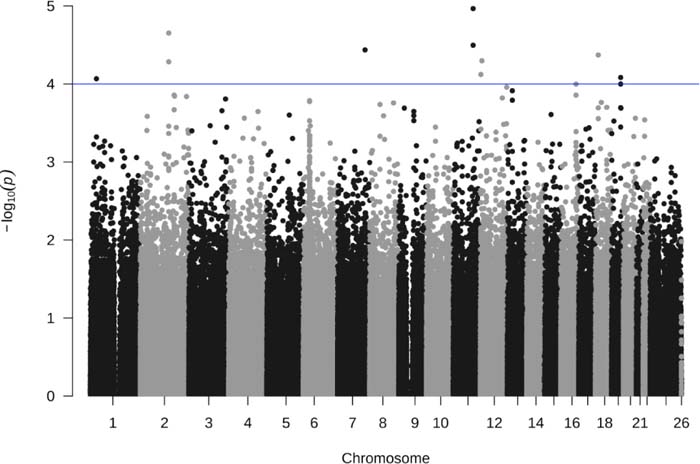
Figure 4. Manhattan plot of genome-wide SNP associations with hypo-response. The dashed line indicates the suggestive significance threshold (1E-4)
Figure 4. Manhattan plot of genome-wide SNP associations with hypo-response. The dashed line indicates the suggestive significance threshold (1E-4)