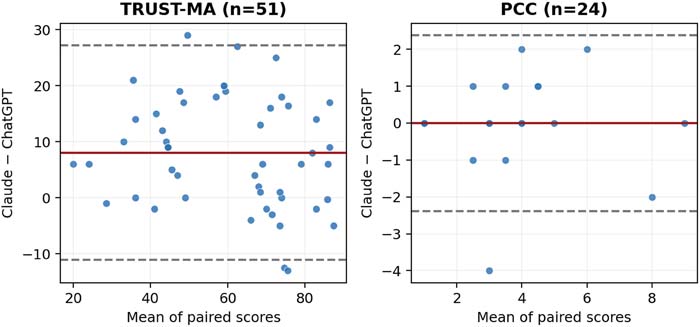
Figure 3. Bland-Altman agreement for TRUST-MA and PCCSolid lines indicate mean paired bias and dashed lines the 95% limits of agreement. TRUST-MA shows a positive Claude bias; PCC shows no mean bias.
Figure 3. Bland-Altman agreement for TRUST-MA and PCCSolid lines indicate mean paired bias and dashed lines the 95% limits of agreement. TRUST-MA shows a positive Claude bias; PCC shows no mean bias.